As my team having been porting a truck-load of hefty Excel reports over to PowerPivot, we've realized just how brilliant PowerPivot is in terms of fast turn-around time analytics. Unfortunately, Tabular doesn't have the maturity of a traditional OLAP engine - and one area where this is most evident is when working with time.
When source data presents fact records with multiple Date columns, a common trick used to avoid having multiple time dimensions is to implement a utility dimension, so that facts are filtered by a single date dimension - but the date column used for filtering is selected by the utility dimension.
PowerPivot/Tabular does not differentiate facts from dimensions, which creates something of a conundrum for report writers... how do you present an analytics model to end users without creating dozens of date dimensions?
In a nutshell, there are pretty much just 2 routes you can follow.... you either:
- UNPIVOT your fact data when populating the tabular model, or
- use DAX to implement "date selector aware" measures.
Let's explore both options...
UNPIVOTing facts
The idea here is to repeat each fact row for each date column that you want to select on.
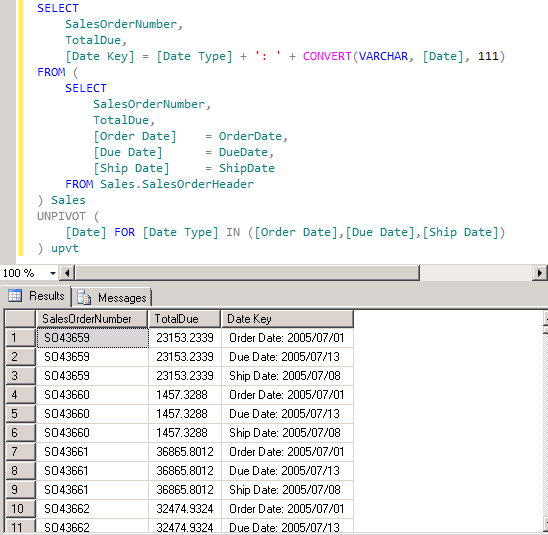
Consider AdventureWorks' SalesHeader table:
OrderDate, DueDate and ShipDate are the 3 columns we want to select and filter on.
To achieve this, we repeat each record for each of these 3 columns, by using T-SQL's UNPIVOT operator:
Notice that we combine the name of the date column along with the date value to form a Date Key.
Because Date Key contains the name of the column under which the date value was found, we have the foundation for filtering dates that originated in different columns. Once the data is pivoted this way we bring it into PowerPivot as the Sales Orders table.
In order to filter Sales Orders, we'll need another three tables:
- Date
A stock-standard "date dimension" to represent the hierarchy of years, months and dates. - Date Type
Contains 3 rows to present a selection of which column any Date filtering should be applied on: Order Date, Ship Date, Due Date. - Date Filter
This table is cross-join of Date Type and Date, bridging any combination of Dates + Date Type to a Date Key.
The PowerPivot engine always implements filtering as "parent to child", meaning Date Type and Date impose filtering onto the Date Filter table. The Date Filter in turn imposes filtering down onto the Sales Orders table via the Date Key column.
Using DAX
The other method of achieving the same result is by implementing all measures as DAX calculations.
The following calculation does the job of filtering total sales based on the date and date type selected:
The above is hideous to read and hard to maintain, but it does get the job done without having to transform the source data.
Weighing up the options
There are some pros and cons of the above techniques:
UNPIVOT
|
DAX
|
Winner
|
Performs well because the formula engine can apply
filters when retrieving rows.
|
Performs slower because all rows are traversed for
each cell being calculated.
|
UNPIVOT
|
Easy to build & maintain.
|
Requires working knowledge of DAX. Complexity increases with every
additional date column.
|
UNPIVOT
|
Produces incorrect results of no, all or multiple “Date
Types” are selected.
|
DAX calculations can detect invalid filtering
criteria and return more appropriate results.
|
DAX
|
Fact rows are multiplied by the number of date columns made
selectable.
|
Fact rows retain original granularity, improving the reusability of
the tabular data.
|
DAX
|
The importance of performance can't be overstated on large data sets - DAX calculations quickly slow down when the formula engine can't apply adequate filtering when retrieving rows from the storage engine.
If you're working with smaller data sets, then UNPIVOT has a clear disadvantage of producing wildly incorrect results when the users clears the filtering on Date Type.
My advice: If you understand and can optimize DAX and you're dealing with mildly brain-dead users, then implement the filters as DAX calculations. If, on the other hand, you are relatively new to PowerPivot, then go the UNPIVOT route - its faster and easier.
Download: UNPIVOT version vs. DAX version
Comments
The idea of having a single Date dimension is that it allows time based intelligence calculations to work correctly in any context selected by the utility dimension.
Moreover, a utility dimension encourages data exploration for end-users, by allowing then to simply choose a new filter in a slicer, rather than having to completely reconstruct pivot tables using different Date dimensions.